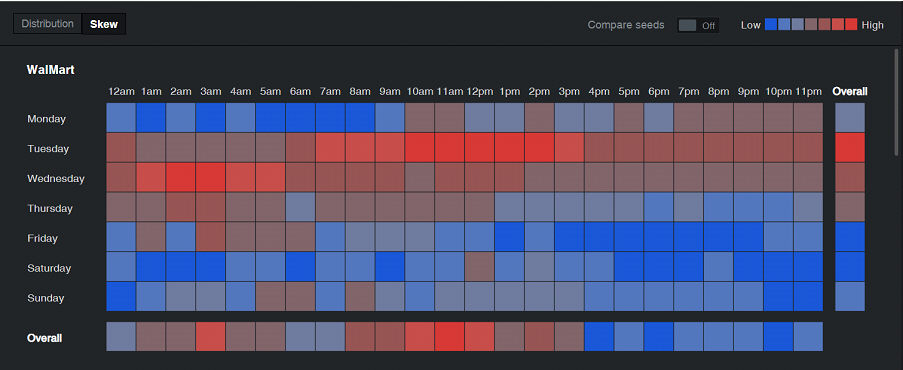
The Timing screen can be found under the Insights screen. It displays the seed consumption breakdown by hours and days.
The Timing tool
This tool enables to identify
key moments during the day and week, where the seed is highly consumed,
or less consumed. The color scale indicates the score of the moment –

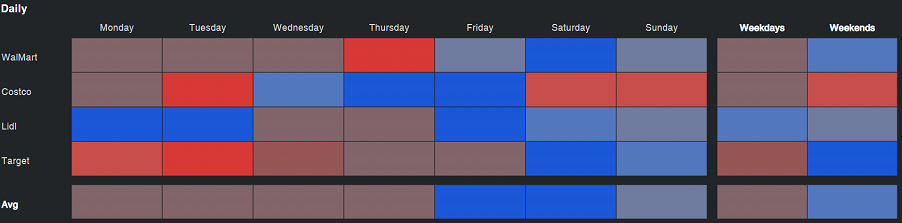
More red - more consumed during that moment.
More blue - less consumed during that moment.
There are two score sets; distribution
and skew 
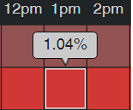
Distribution – this score set breaks down consumption per days/hour. According to this score, the color of the square is determined by the amount of consumption during that moment, out of the total consumption. That means that the "reddest" square has the highest share of consumption compared to the other squares. As the scores tend to be in slight margins, the color is not always very indicative, yet, by scrolling the mouse over the specific square reveals the numeric score of the moment.
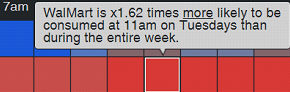
Skew – this score shows the extent to which the seed interest is over-indexed at a certain hour/day compared to the entire week. That means that the "reddest" square is the moment where consumers are most likely to engage with the seed.
Overall
The overall bar below and to the right show the average score for the according cells. In the example above, Walmart is most likely to be consumed on Tuesdays among the rest of the week days, as seen in the bar to the right, and at 3 am as seen in the bar below.
Timing tool actions
 - this actions enables
to compare between different seeds in order to efficiently target
the brand's weaker/stronger moments compared to its competitors'.
For example we can see a correlation between the brands in the most
consumed hours. Yet, when looking at the daily breakdown, Costco is
stronger during the weekends and Target is stronger during the
weekdays.
- this actions enables
to compare between different seeds in order to efficiently target
the brand's weaker/stronger moments compared to its competitors'.
For example we can see a correlation between the brands in the most
consumed hours. Yet, when looking at the daily breakdown, Costco is
stronger during the weekends and Target is stronger during the
weekdays. 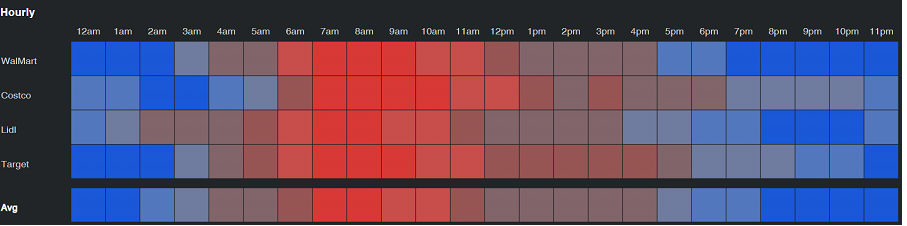
Filter – filter the results by channel, topics or geo.
Time set – define the
requested time period of 1 month or 3 months, or define a costume
period 
See Also: