Geos
The Geos Tool
This tool enables to see which areas are more or less likely to engage
with particular brands or products compared to the national average. This
can help you in a research and planning sense, by deciding which areas
to target or where to focus conquesting efforts. In a delivery use case,
we can change impression delivery based on where users are geographically
most likely to engage with the campaign messaging. data is available
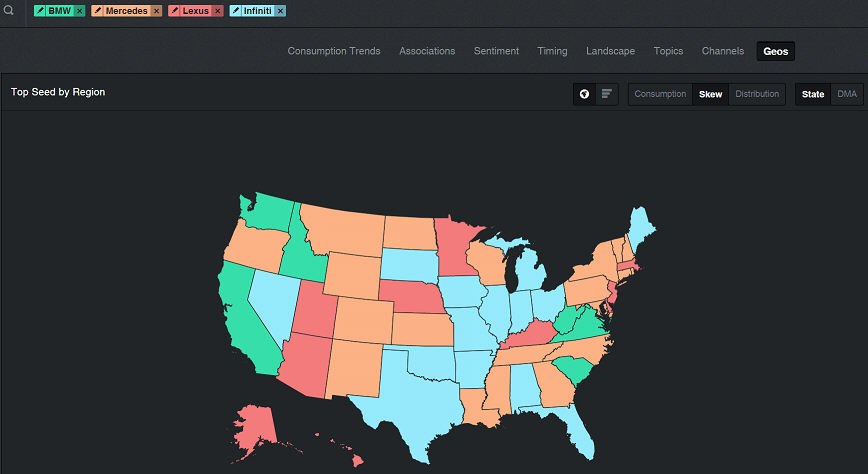
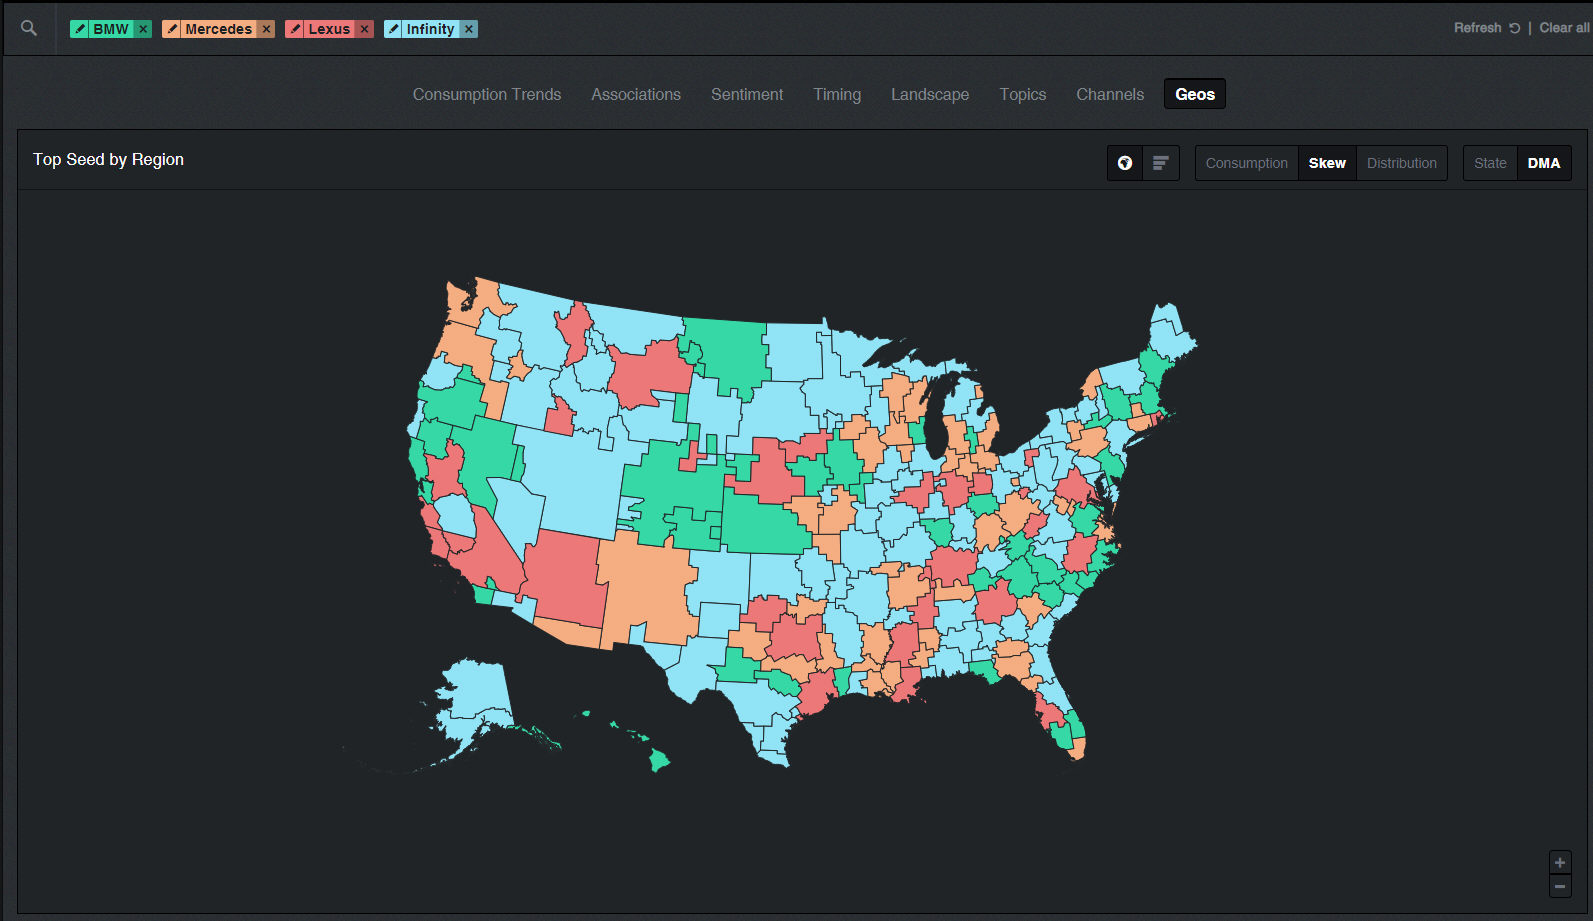
The data can be demonstrated by a state-by-state breakdown or DMAs;
that is determined by clicking on the bar above the graph.
Data set
- there are three data sets –
- Consumption
– represents how often a seed interest is consumed in relation to
a certain region, compared to the other displayed regions. The displayed
region with the highest consumption is given a score of a 100.
- Skew
– the extent to which the seed interest is over-indexed within a certain
region compared to the entire country.
- Distribution – the percentage of a region
consumption out of the total interest consumption.
Geo tool actions
- To open the Geo tool, in
the Insights screen, click Geo above
the graph display.
- Display – change from map
to list display by clicking on the requested display

- Data set -– change from
Skew to Distribution or Consumption display by clicking on the requested
set
- Content drivers –
click on the
 to the right of a topic to display
content examples that drove consumption.
to the right of a topic to display
content examples that drove consumption.
See Also:
Consumption
Trends
Associations
Sentiment
Timing
Landscape
Topics
Channels