The Topics section displays the seeds’ consumption by contextual topics, similar to IAB topics. This allows you to compare the consumption of the seeds by topic, for example, you can see the topics where your brand is more highly consumed than your competitor, and where it needs to improve.
The seeds’ consumption can be displayed in three ways – consumption, topic distribution and skew;
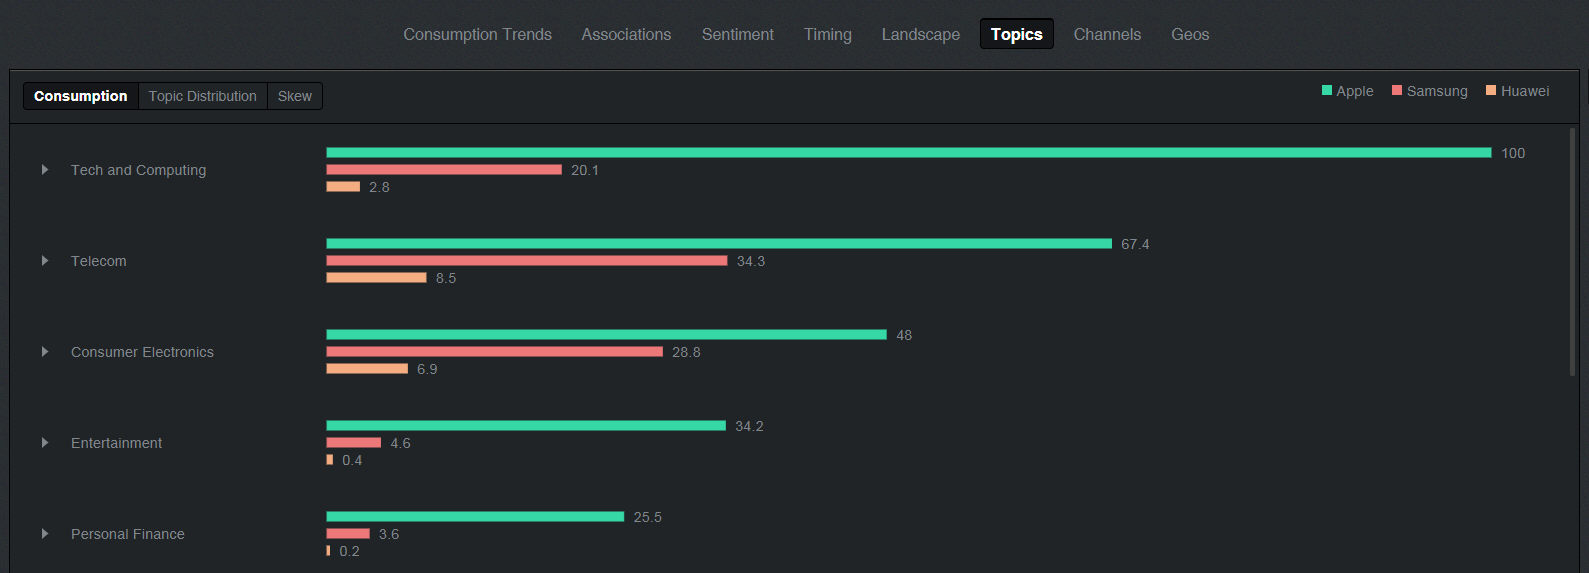
Consumption - is measured based on a relative index score, as in the Consumption Trends. The scores displayed are the average scores over the time period defined in the Time filter.
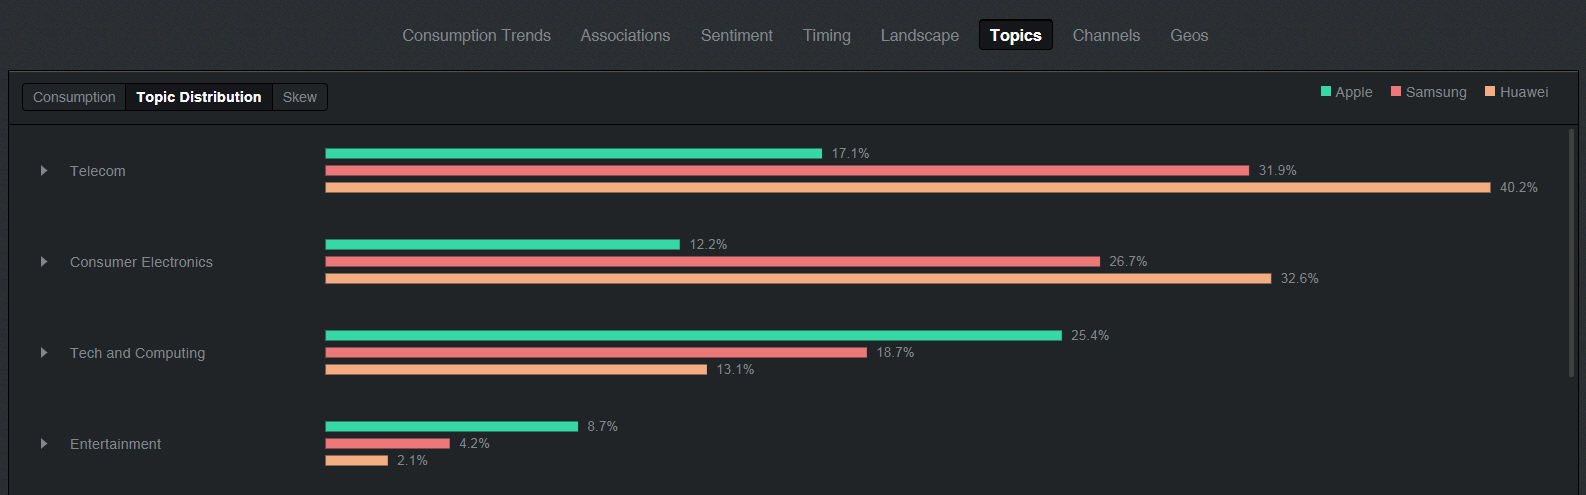
Topic Distribution – the score measures the percentage of consumption that a seed interest is consumed within the topic, out of the total seed consumption.
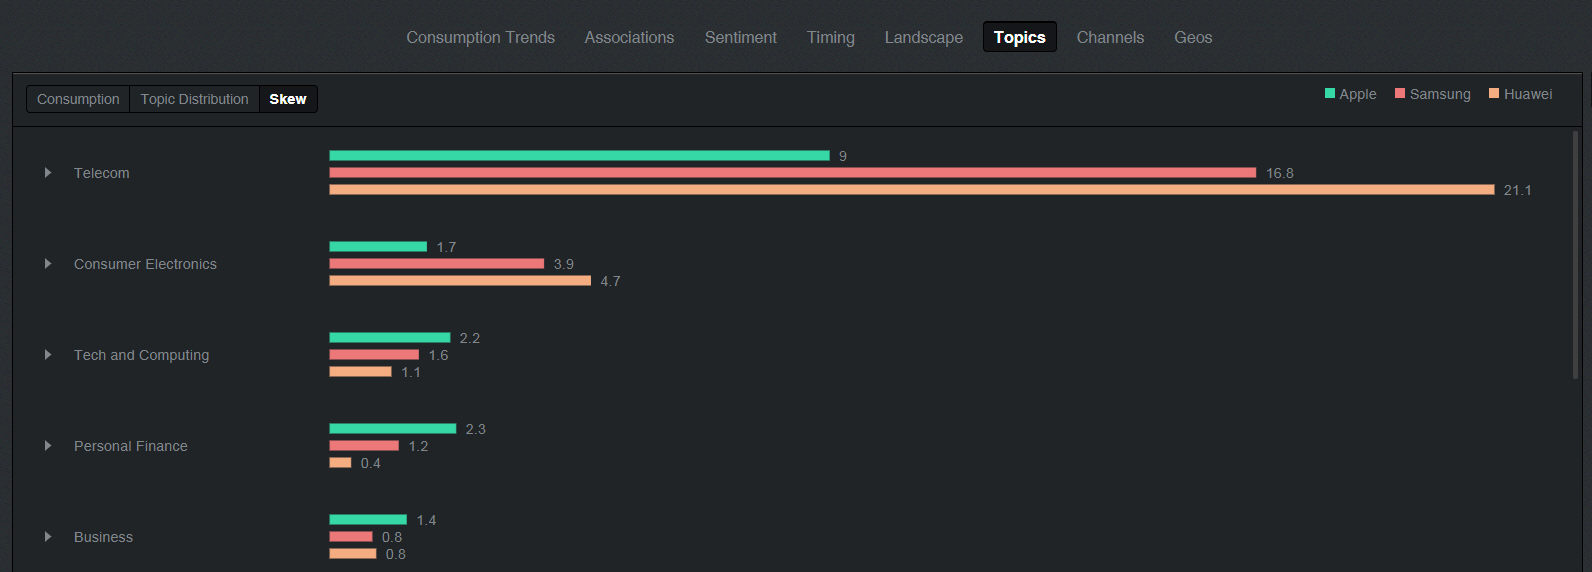
Skew – measures the extent of which the seed interest is over-indexed within the topic consumption compared to all topics combined. In the example below, Samsung is X16.8 times more likely to be consumed within Telecom than in all the topics combined.
To the right of the graph
are the Content Drivers. Click the Content Drivers button  on the right to see the
content items that drove the consumption of the seed interests.
on the right to see the
content items that drove the consumption of the seed interests.
Topics tool actions
To open the Topics tool, in the Insights screen, click Topics above the graph display.
From the Topics tool, you can open a Consumption Trend graph for one specific topic by clicking the required topic’s name to the left of the graph. The score displayed in the graph is an index relative to all consumption, and not only consumption of the selected topic. Therefore, the highest score displayed is not 100. The Consumption Trend graph is accompanied by a list of examples of the seed interests’ sources. The list behaves in the same manner as the Consumptions Trend examples list (see Consumption Trends).
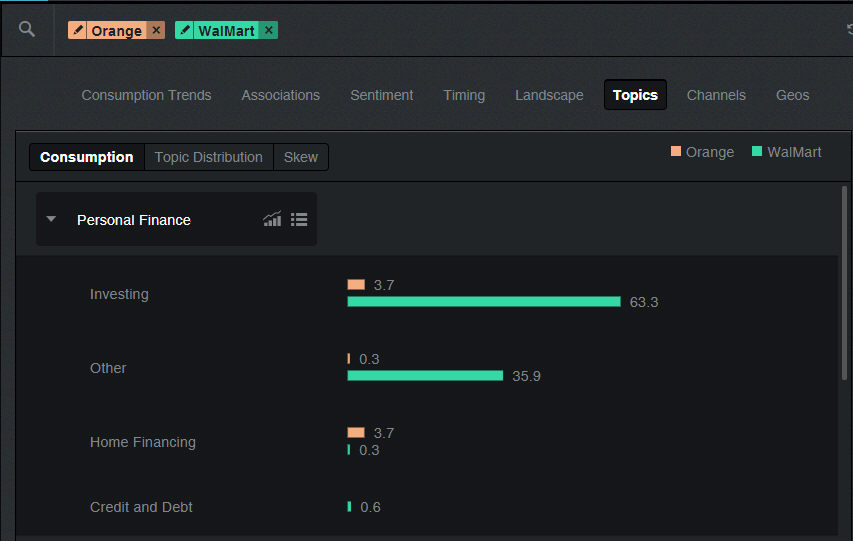
By clicking on the arrow to the left of the Topic name, you can drill down to sub-topics and see their consumption, distribution and skew score.
See Also: