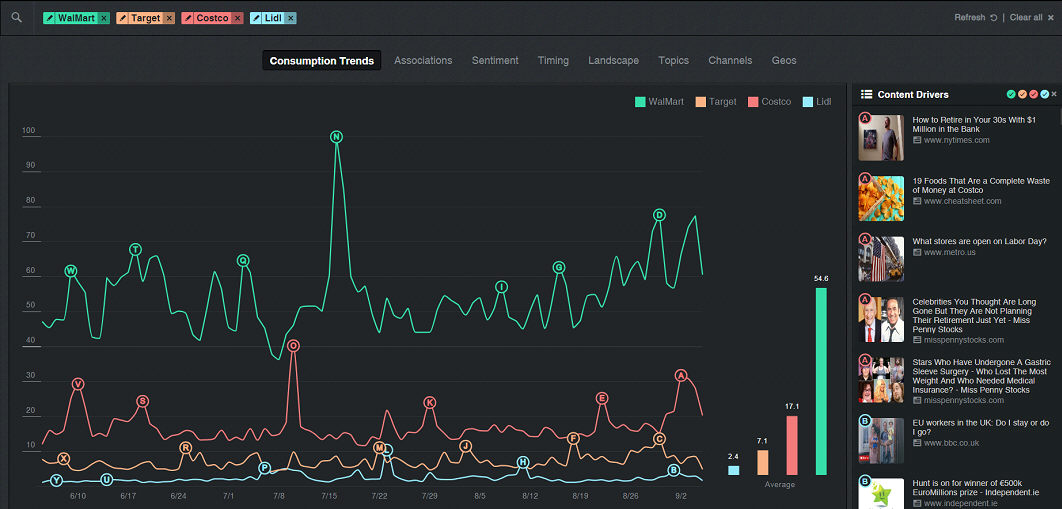
The Insights screen is a research tool that displays historical trend graphs of consumption, and breaks it down to key dimensions. With the help of the Insights screen you can see the consumption history of a seed interest, for instance your brand or a relevant term, over a period of a month, up to a year. You can also compare your brand’s performance compared to other seed interests, for example a competitor’s brand (see Consumption Trends).
The Association Comparison tool provides a list of other words and phrases that are viewed most often with your seed interests, and compares the consumption of each one with the seed interests (see Associations).
The Sentiment screen shows consumer sentiment towards your seed interest. It displays the percentage of viewers that feel positively, negatively, or neutrally towards the seed interests over a set period of time (see Sentiment).
The Timing tab breaks down average consumption per days and hours intra-day, and enables to spot key targeting moment where the seed interests is most consumed, or where competitors' stand out more. This can help determine dayparting, impression timing, etc. (see Timing)
The Landscape feature allows us to map out various brands as they rank for various metrics that the platform is able to track, ranging from overall engagement to sentiment, association strength to social engagements (see Landscape)
You can also see what people are viewing when they see your seed interest. The Topics tool shows the topics where a seed interest, for instance your brand, is more highly consumed than your competitor, and where it needs to improve (see Topics).
The Geo breaks down US-consumed data to states or DMAs and enables identifying areas that are more or less likely to engage with particular brands or products compared to the national average (see Geo).
The Insights screen
To open the Insights screen
In the upper left of the screen, click the
Menu button  and click Insights, or click
the Insights icon
and click Insights, or click
the Insights icon  (without opening
the menu).
(without opening
the menu).
See Also: