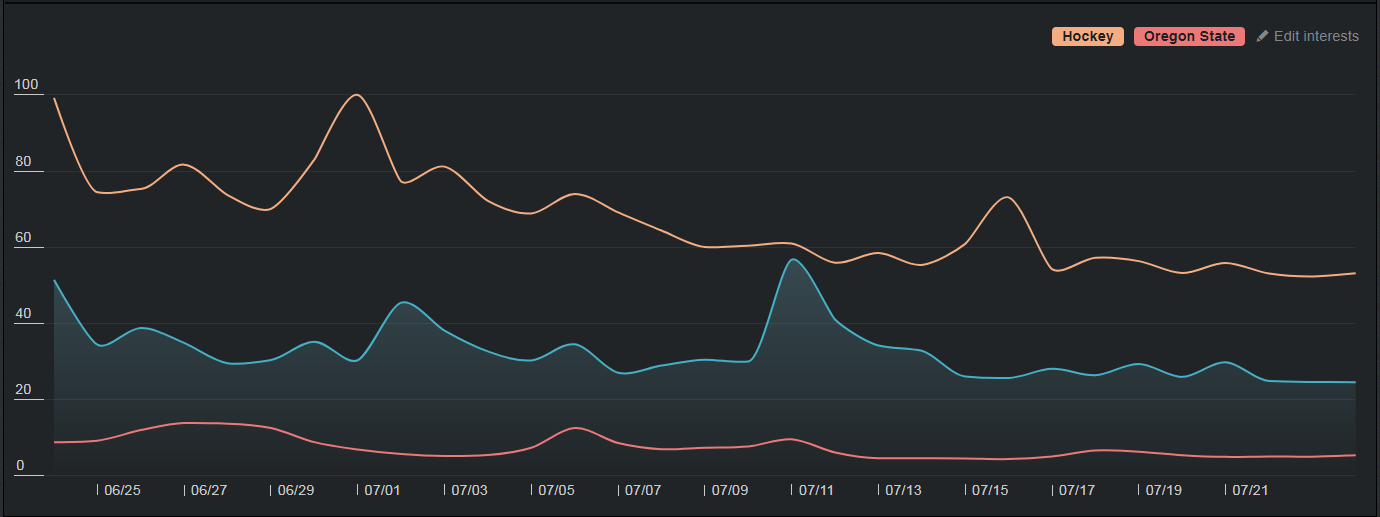
The Brand Consumption Trend graph dominates the center of the Dashboard screen. It displays the main interest’s consumption trends, as compared to the program’s key interests over the last month (for more information about your program, see Editing My Program).
Note: |
An interest’s consumption is the amount of times it was read or viewed in sources (such as articles, tweets or videos). |
Consumption Trend graph
The trend is relative to an index, where the peak content consumption is given a value of 100, and consumption levels are given an index relative to that.
See Also: